By Walter Cronin
This post may get a bit technical for some readers and is directed toward professional, global vegetable oil traders and those recent entrants into this space, the renewable diesel feedstock traders. Welcome.
The soybean oil futures market, widely used to hedge various global vegetable oil risk inclusive of other oils beyond soy, has sent an early “I’ve bottomed” signal and “I might start trending higher” signal as well.
First, let’s have a look at the Chicago Mercantile Exchange’s complete futures curve, always the first place that most of us fundamentalist, discretionary traders head to for an understanding of the structure of the market which should closely reflect supply and demand (in most relatively free markets).
Basis Monday’s market close, the soybean oil futures structure shows a carrying charge on the very front end of the curve (May soybean oil at $.5457 and July soybean at $.5470 per pound) giving some incentive, not a lot, but some, to buy oil today $.0013 points cheaper than in the future, i.e. $.5470 – $.5457 = $.0013. This carry structure incents purchases for today’s demand as well tomorrow’s, i.e. buy it today and carry it because it is cheaper today than it is tomorrow, thus a “carry” market.
And that “carry” makes sense because physical traders have found it more advantageous to sell soybean oil via the futures market instead of direct to consumers in the physical market, never a good sign for demand and nearly always a sign that physical supply exceeds demand. Soybean oil receipts in the CME’s “deliverable commodities under registration” report tally 613 sitting in the delivery window waiting for a buyer, often referred to in trader lingo as a “sponsor”. The buyer or sponsor will not buy these soybean receipts oil until the price of physical soybean oil exceeds futures prices by a certain value (this begins to include some freight and execution calculations that are not necessary for illustrative purposes today). 613 receipts, each representing a 60,000-pound rail tanker car topped up with soybean oil sit in the “delivery window” with the majority at a Cargill Inc. facility at Creve Coeur, IL (highlighted in yellow).
That the market remains in a carry makes sense given these receipts sitting in the delivery window because the holder of these receipts incurs storage costs and must get paid to carry the soybean oil (in this case a fraction of the total costs given the limited carry but at least there exists some contribution to offset the storage costs).
Still with me?
Now comes the point of the matter.
For the holders of those soybean oil receipts to keep holding they must have an economic reason, primarily that the price of soybean oil will be higher in the future and so it makes sense to hold on to the receipts today because the holder owns the cheapest soybean oil available.
And this is the issue.
The price of soybean oil is cheaper in the future not more expensive.
The full futures curve above details the prices and the below chart helps illustrate the concept. The chart features the spread relationship between the July soybean oil futures contract and the December futures contract and the chart details that the July price is $.0153 cents per pound higher than the December price. July soybean oil futures priced at $.5470 – December at $.5317 per pound. The market is inverted (in backwardation for renewable diesel traders) with nearby prices higher than deferred prices.
What is the message of the inverse, not this one, but any market that features an inverse for the consumer: delay consumption until later because the price is cheaper in the future and near-term supplies are tight so prices must necessarily reflect the tightness with higher near-term prices.
The inverse sends a signal to the soybean processing producer as well: do not store a single pound of soybean oil; sell every pound produced against the July higher price instead of the December lower price.
As the chart above displays, that inverse has weakened dramatically over the last months from a near $.03 inverse to its current $.0153 per pound, but the price curve still remains inverted. Nearby physical supplies and receipts sitting in the delivery window have not been able to break the inverted curve into a carry structure.
In summary, the market’s imperatives are these:
Consumer: delay consumption until later, supplies are tight
Producer: sell everything today or face economic penalties (lower prices) in the future
Still with me?
Along comes the National Oilseeds Processing Association (NOPA) report yesterday. It is the NOPA’s (primarily the US soybean processing industry’s business association) report that details member operating rates.
Yesterday’s release printed an extremely high run rate for the month of March 2023.
Second highest crush rate ever means the US soybean processing industry is pushing at its highest level of production capacity inclusive of newly completed capacity. If that isn’t sufficient crush capacity producing enough soybean oil to meet the demands of the domestic food and renewable biomass industry then the market has a supply problem and the market has this function: curtail demand. And curtailment occurs with higher inverses and higher prices.
The markets “supply is tight” response to the NOPA report yesterday, higher soybean oil prices and stronger inverses, signaled a potential bottom for prices.
Let’s see what happens next. Confirmation that the market is entering into a new demand exceeding supply phase (due renewable diesel capacity expansion and an increase to the capacity utilization of refineries that to date have not met market expectations) would include the following:
- Strengthening physical soybean oil basis
- Strengthening soybean oil futures inverses
- Consumers beginning to purchase soybean oil via the CME’s delivery mechanism due to tight physical supplies
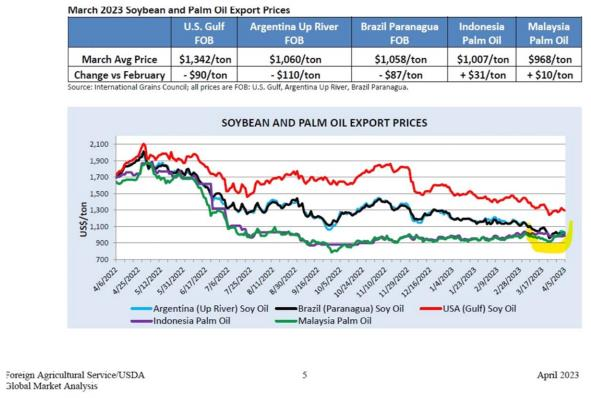
- The whole price structure of all vegetable oils turning higher (see palm prices turning higher highlighted in yellow below)
Here is how the USDA snapshotted global values a week ago.

Finally, take a look at the CME’s palm oil curve that I included in the snapshot with the full soybean oil futures curve. Hint: the carry is gone.
The writer was the Chief Commercial Officer at Green Plains Inc. until August 2021.


